Over the past five years, Kentucky’s population grew by 2.2% according to new Census data, ranking the commonwealth 23rd among states. A closer look at the components of population growth (births, deaths and net migration) reveals patterns critical to understanding state population trends and crafting helpful, and not harmful, policy responses. More deaths than births were the major drag on population over this five-year period, while in-migration from other states and nations improved compared to the prior decade. The data tells a story of an aging baby boomer population and the losses from the COVID-19 pandemic in a state with lower-than-average life expectancy, the important role of international immigration and the likely impact of high housing prices in the state’s biggest cities on where people live.

Low life expectancy and aging of baby boomers are dragging down population numbers, especially in rural areas
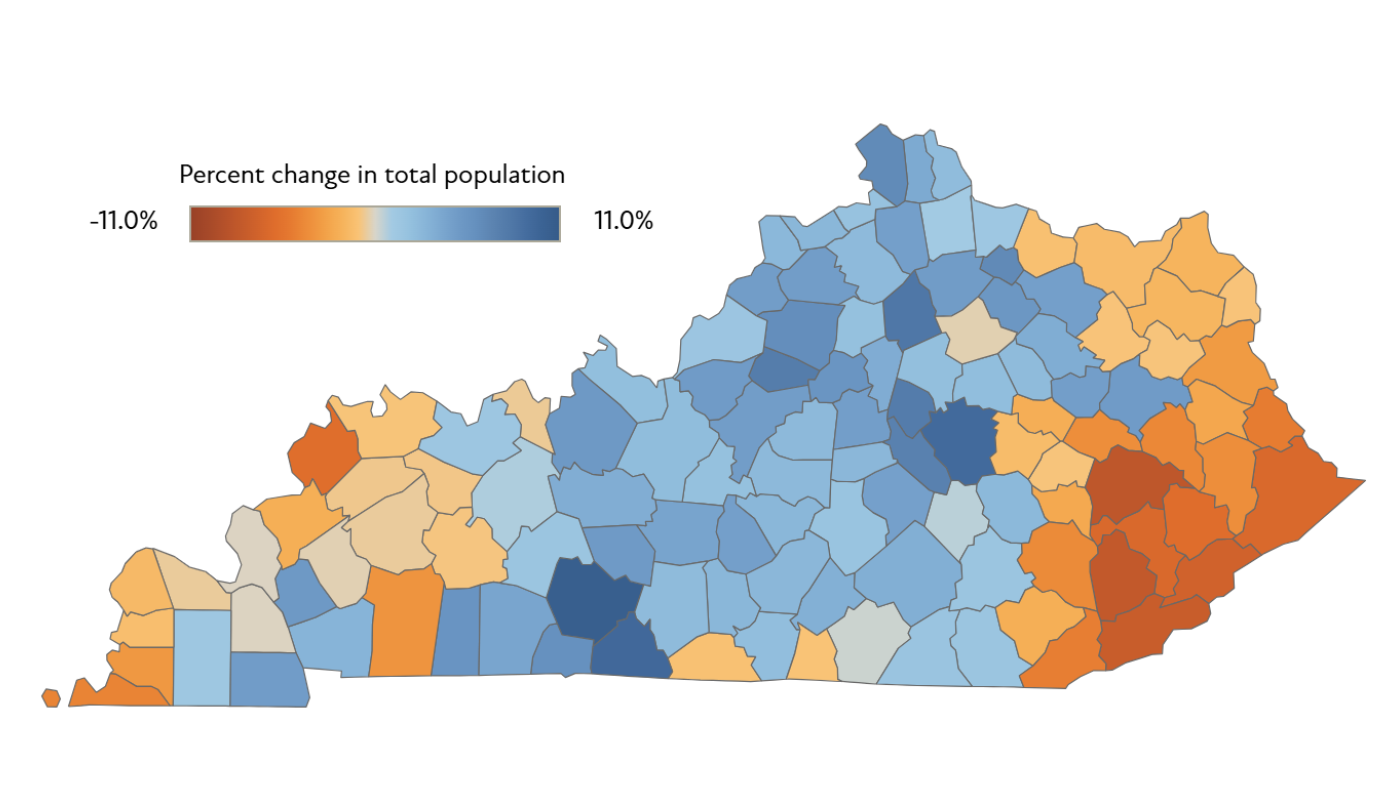
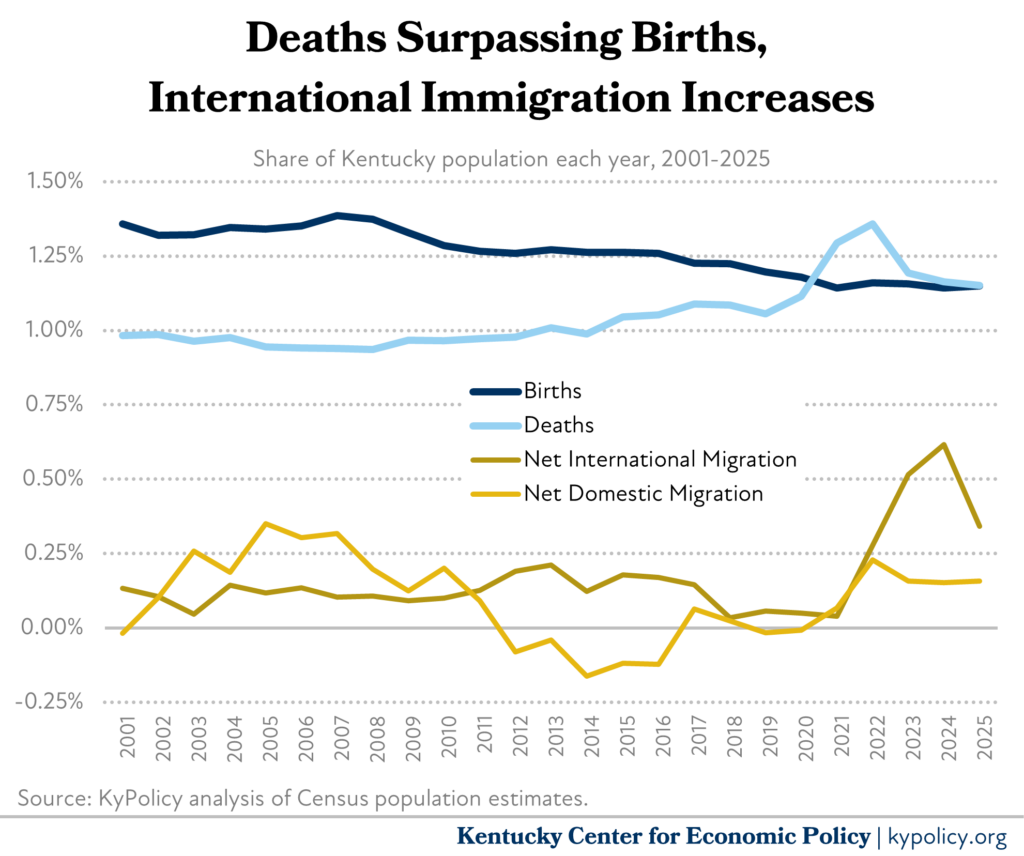
The number of Kentuckians who died exceeded the number born between the years 2020 and 2025, and population was lost from natural changes in 100 of the state’s 120 counties. In contrast, births exceeded deaths in the previous 20-year period (2000-2020). This reversal reflects in part the impact of the COVID-19 pandemic, which caused deaths to spike in 2021 and 2022. But key to this trend is the aging of the large baby boomer population and troubling trends in life expectancy, especially in rural Kentucky, as well as long-term declines in birth rates.
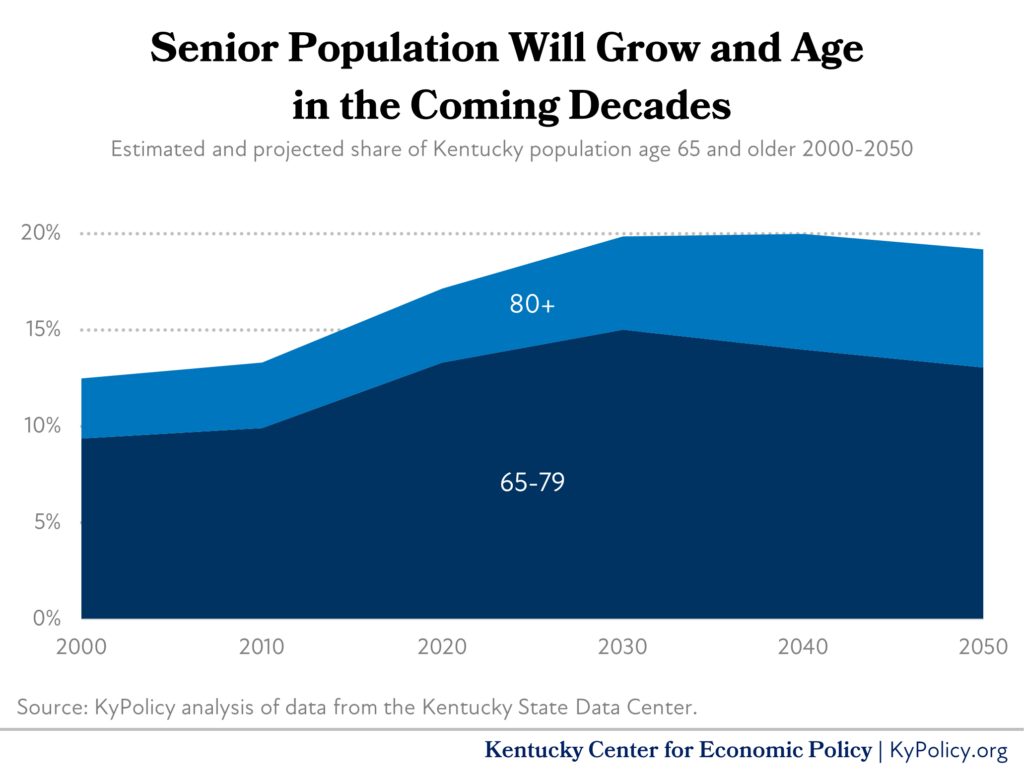
Even without the pandemic, the aging of the baby boomers born after World War 2 is swelling the senior population and leading to elevated death rates. In 2026, the youngest baby boomers turn 62 years old and the oldest are 80. As this group has aged, the senior population has grown and will continue to age for a couple more decades, as shown in the graph below. We can expect higher death rates to continue in the coming years nationwide as this group ages further, a trend one writer called “the long boomer farewell.”
However, this reality is happening sooner in Kentucky with the state’s death rate now among the highest in the country. In part, this reflects a comparatively low and even declining life expectancy caused by poorer health. Kentucky women born in 1950 can expect to live an average of 78.1 years, seven years less than the leading state. It’s 72.1 years for men, six years less than the healthiest state. What’s worse, life expectancy has been declining in Kentucky recently even while seniors in other states are living longer. One factor is greater mortality in Kentucky from “deaths of despair” due to drug overdoses, alcohol-related liver diseases and suicide.
Life expectancy also varies widely between counties, resulting in higher death rates in many eastern Kentucky communities. Whereas average life expectancy in Owsley County is 64.9 years, the average in Oldham County — the state’s wealthiest county — is 15 years longer at 80.3 years. In addition, there are big gaps within certain counties. The gap in life expectancy between the primarily Black west end of Louisville and the mostly white east end is similar to the gulf between Owsley and Oldham counties.

The state’s fertility rate (rates of birth per women of childbearing age) is above average among states but has been declining over time. Kentucky and the nation experienced a big drop in births when the Great Recession hit in 2008 and worsened economic conditions made many people hesitant to have children. Rising family costs in recent years also play a role, including inflation in housing, child care and higher education. Declines in teen pregnancy, delays in average age of birth for mothers, the growth of women in the workforce and shifts in cultural values also contribute. Those counties where births exceed deaths tend to be more prosperous metro and suburban counties like Warren, Boone, Scott and Fayette.1
More people are moving to Kentucky than leaving, and most net migration is international
Net migration to Kentucky is positive and has increased compared to the previous decade. International immigration makes up 70% of the net growth from migration over the 2020 – 2025 period. Without immigration from other countries, Kentucky’s population growth would have been small. Factors that contributed to an increase in international immigration include a strong post-pandemic economic recovery that spurred demand for workers; delays in processing immigration during the pandemic; and violence, political instability and economic crises in home countries.
Immigrants play an important role in the Kentucky economy, as KyPolicy and the Immigration Research Institute describe in a recent report. It is unclear what the full impact of the Trump administration’s increased deportation strategy, and the involvement of some local law enforcement agencies in cooperating with that effort, will be on the state’s immigrant population numbers.
International immigration tends to be concentrated in a few counties that have more job opportunities. Nearly half of net international migration is to Jefferson County, and 70% is to Jefferson, Fayette and Warren Counties. These three counties are also the primary locations for refugee resettlement in Kentucky.
The remainder of the population growth due to migration is from within the United States. This number was slightly positive over the last five years, with a net 0.15% per year on average of the Kentucky population moving from other states (subtracting those leaving Kentucky). That is an improvement from the period 2010-2020, in which there was a small population loss from net domestic out-migration of 0.04% of the population per year on average.
Out-migration from the eastern Kentucky coal counties has slowed. From 2010-2020 these counties lost 1.2% of their population per year on average due to net domestic out-migration (to other Kentucky counties or somewhere within the United States).2 In the 2020-2025 period, that rate slowed to 0.02% per year.
Suburbs are growing relative to cities, with housing prices likely key
The state’s two biggest counties, Jefferson and Fayette, are experiencing only small net population increases driven primarily by international migration. They are both losing population from domestic out-migration, likely driven in part by rising housing prices.
Jefferson County’s population grew by 1.2% over this five-year period due to net in-migration. However, the county lost 29,476 people due to domestic out-migration while gaining 38,900 from international in-migration. Similarly, Fayette County’s population grew 0.9% from in-migration. But the county lost 11,300 people from domestic out-migration (after gaining a very small number of net domestic in-migrants in the prior decade) while bringing in a net 14,200 from international in-migration. Immigrants from other countries are moving to our two largest cities, while more domestic residents are moving out.
Suburban areas immediately outside of Lexington, Louisville and Cincinnati, however, are experiencing higher rates of in-migration. Domestic in-migration accounted for over 75% of the population increase on average in Madison, Bullitt, Scott, Oldham and Jessamine counties over this five-year period. High housing prices in the state’s cities could be one of the factors contributing to faster growth in some of these suburbs over this period. These fast-growing suburban counties are also more likely to have births exceed deaths as they increasingly become places where families with children reside.
Also experiencing significant in-migration are two southern Kentucky growth areas. Warren County’s net in-migration from 2020 to 2025 was 8% of the population, with 5% consisting of domestic migration and 3% international. Pulaski County also attracted a significant number of net domestic in-migrants.
Many of the new numbers extend existing trends
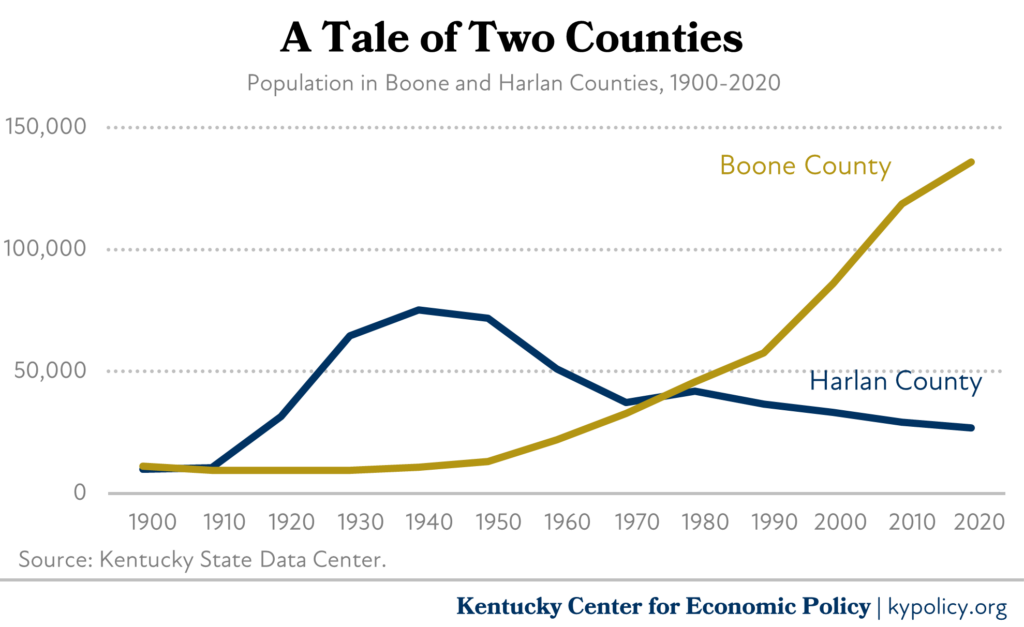
In many ways, this new population data continues long-term trends. From 1900 to 1940, the population in southern, central and northern Kentucky was similar in size to eastern plus western Kentucky, and the regions grew together. But paths diverged beginning in 1950, due in part to mechanization of industries like coal mining. Now, nearly 70% of the population lives in the middle part of the state.
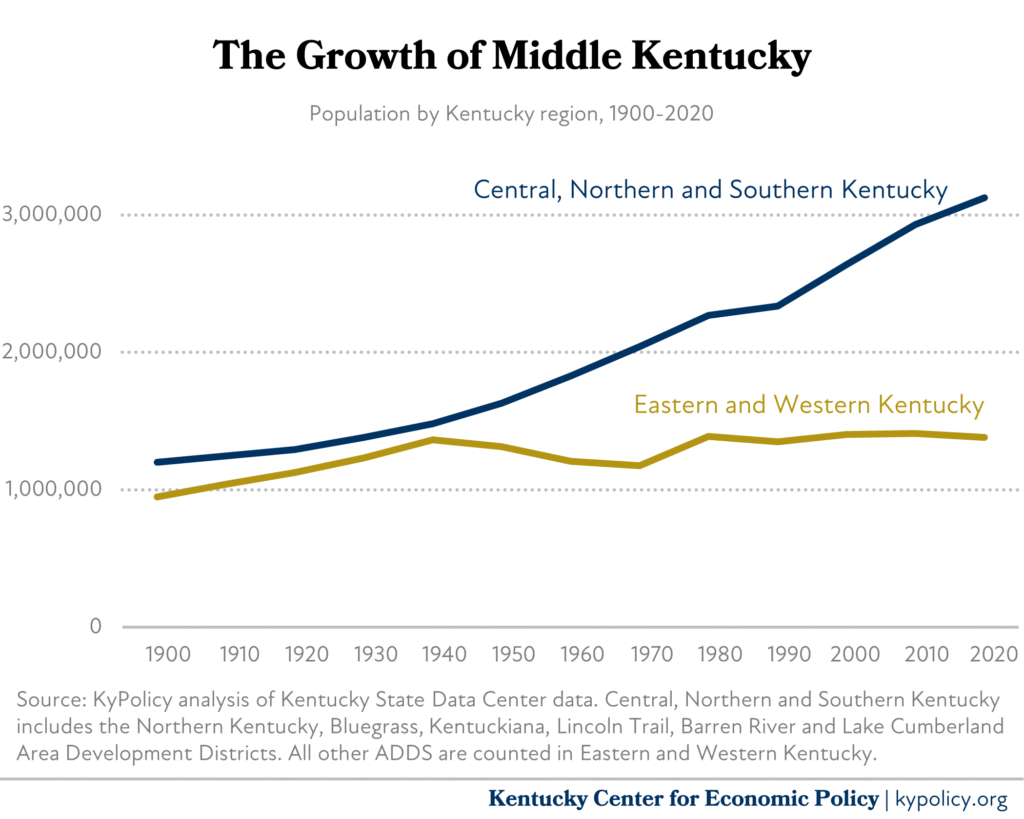
The numbers are even starker at the county level. Harlan County, for example, peaked in 1940 at a population of 75,275. As of 2020, it had dropped to 26,831. Boone County, in contrast, only had a population of 10,820 in 1940 and 135,968 by 2020.
Holistic and evidence-based approach is needed to promote a healthy population
There is no one answer to what population trends should look like. But it is important to understand what is changing and identify policy barriers to supporting a healthy population. That requires a comprehensive approach and an evidence-based understanding of demographic trends.
However, there are common misconceptions about demographic issues that are used to support policy conclusions that can cause population harm. One important issue to understand is that, while domestic migration certainly exists, the share of the U. S. population that moves has been declining for decades. Nevertheless, much public policy discussion focuses narrowly on how to get people to move from another state to Kentucky. But that priority doesn’t necessarily improve the lives of the vast majority of people who are already here and may be ineffective and even counterproductive when considering the size of the population that moves each year and what factors motivate their relocation.
For example, some people promote lower taxes as a strategy to attract in-migrants. But only 1.5% of people make interstate moves each year, a rate that has fallen by half since the 1980s. In addition, most of those who move report doing so because of job-related issues like a new job and transfer or for family considerations, with the remainder moving due primarily to housing costs, health issues and a better climate. Taxes play a minimal role in these decisions.
In addition, Census data shows that 70% of people born in Kentucky still live here, a percentage that is even higher in many rural counties. Tax cuts take resources away from investments needed to improve the lives of Kentuckians today, like education, health care, housing and infrastructure. Improving living conditions in Kentucky, along with creating a welcome environment for people from other states and countries, will naturally make the state more attractive for that small share of U. S. residents considering such moves. And more importantly, it will help Kentucky residents live better and fuller lives — including the ability to afford having children if they desire to do so.
Those quality of life of investments will also be critical in the coming years as the baby boomer population continues to age. Kentucky will face a major challenge providing the care infrastructure needed to promote quality living in boomers’ final years and ensure good jobs for those providing that care. Programs like Medicaid that finance long-term care, and policies that increase job quality – like support for care sector unions and increases in wage standards – will be essential to meeting this challenge. Creating good care jobs also has the advantage of improving family living standards and thereby helping the next generation of Kentucky kids.

- Christian County also a high birth rate, but its population is an anomaly because of the Fort Campbell workforce. Christian also has the highest rate of net out-migration of any county over this period, likely related to troop deployments and assignments at Fort Campbell.
- Includes Bell, Harlan, Knott, Letcher, Pike, Perry, Martin, Leslie and Floyd counties.