The Kentucky General Assembly recently enacted a new state budget that underfunds Medicaid relative to the agency’s request, resulting in the administration announcing 4% cuts in the payment rates to Medicaid providers. In addition, the One Big Beautiful Bill Act (OBBBA) passed by Congress will reduce the number of people receiving Medicaid and the payments to hospitals and other providers.
These cuts will harm Kentuckians in two ways. First, they will reduce the number of people receiving Medicaid-funded services and the types of services that are available to them. These reductions will happen as individuals are taken off the rolls and as certain providers no longer take Medicaid, are forced to reduce the services they offer or close altogether. Second, they will reduce economic activity as fewer dollars flow into communities to pay nurses, therapists, physicians and other health care workers.
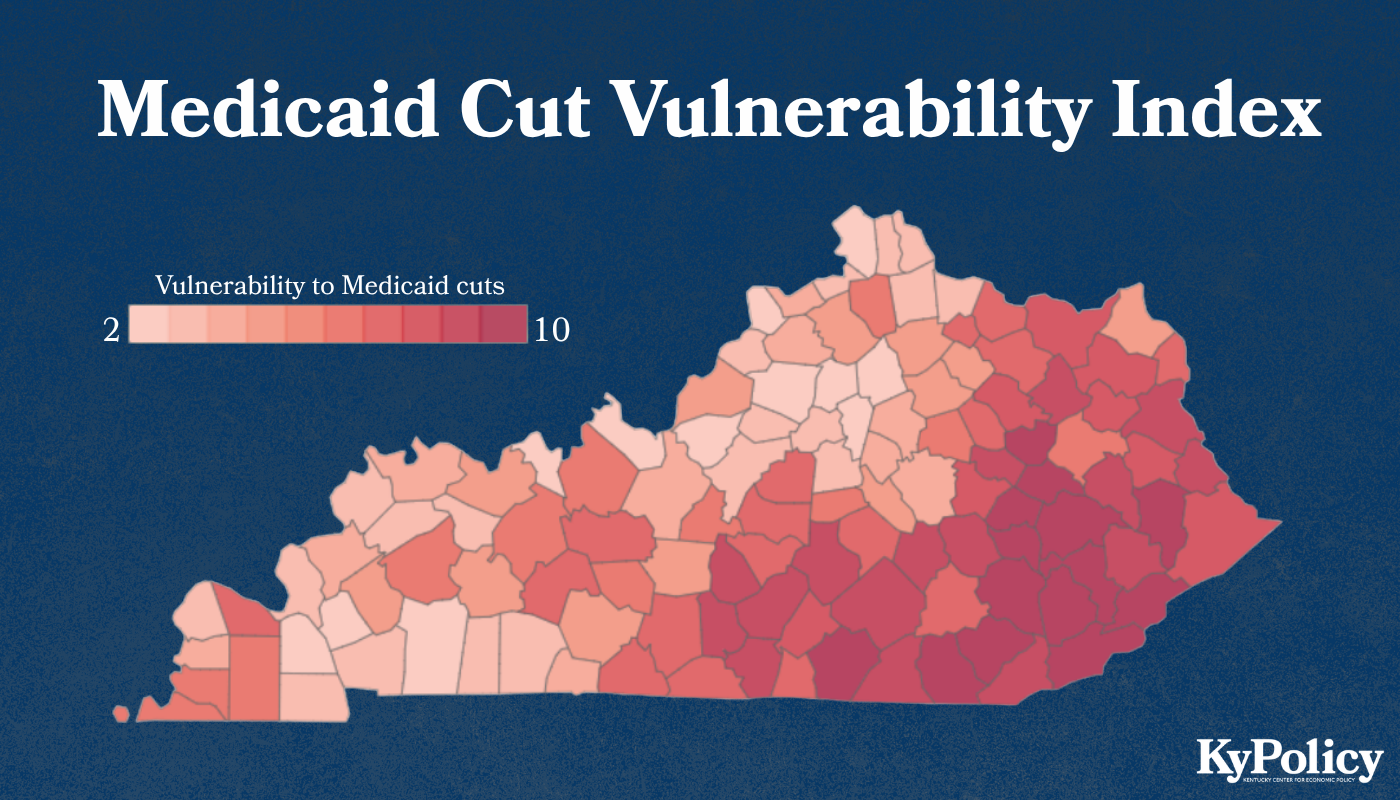
While Kentuckians across the state will be hurt by these cuts, residents of some counties will be harmed more than others. The map below contains an index of vulnerability to Medicaid cuts based on two factors: 1) the share of the population covered by Medicaid; and 2) Medicaid payments to providers located in the county as a share of county gross domestic product (GDP). In different ways, these two factors estimate a county’s risk by looking at how much the population relies on Medicaid for health care and how much the local economy depends on Medicaid dollars due to the presence of clinics, hospitals and other providers.1

The counties with the highest vulnerability to Medicaid cuts are all in eastern and southern Kentucky. The localities listed below rank in the top 20% of Kentucky counties for the share of the population covered by Medicaid and for Medicaid spending as a share of economic activity:
- Breathitt
- Clay
- Floyd
- Harlan
- Knox
- Lee
- Leslie
- Letcher
- Menifee
- Owsley
- Perry
- Wayne
- Whitley
- Wolfe
While it is no surprise that these rural counties have the highest share of people covered by Medicaid, it is notable that they also rank among the highest in the economic importance of Medicaid spending. Although specialty health services tend to be located in larger cities, Medicaid providers are spread throughout the state and matter deeply to rural economies. Kentucky has 35 rural hospitals at heightened financial risk from these cuts (including closure), the most of any state.
All counties, but especially those in rural and eastern Kentucky, face the double threat of worse health and a weaker economy if state and federal decision makers allow these cuts to continue.
Medicaid Cut Vulnerability Index
| County | People with Medicaid | Medicaid coverage as share of pop. | Coverage Index | Medicaid spending | Medicaid spending as share of GDP | Spending Index | Total Index |
|---|---|---|---|---|---|---|---|
| Owsley | 2,752 | 68.8% | 5 | $15,827,793 | 23.0% | 5 | 10 |
| Wolfe | 3,954 | 62.9% | 5 | $17,227,888 | 10.9% | 5 | 10 |
| Knox | 17,941 | 60.2% | 5 | $114,268,741 | 13.7% | 5 | 10 |
| Bell | 13,848 | 59.4% | 5 | $71,883,920 | 7.2% | 4 | 9 |
| Clay | 11,585 | 59.0% | 5 | $74,742,629 | 16.4% | 5 | 10 |
| Harlan | 14,233 | 56.2% | 5 | $75,792,967 | 10.0% | 5 | 10 |
| McCreary | 9,507 | 55.8% | 5 | $26,979,964 | 9.3% | 4 | 9 |
| Magoffin | 6,255 | 55.7% | 5 | $30,994,724 | 8.9% | 4 | 9 |
| Breathitt | 6,802 | 52.5% | 5 | $34,659,346 | 11.3% | 5 | 10 |
| Whitley | 19,285 | 52.4% | 5 | $230,276,423 | 14.8% | 5 | 10 |
| Knott | 7,099 | 52.0% | 5 | $18,752,666 | 6.8% | 4 | 9 |
| Perry | 14,063 | 51.8% | 5 | $267,846,276 | 20.7% | 5 | 10 |
| Clinton | 4,715 | 51.5% | 5 | $14,014,952 | 3.0% | 2 | 7 |
| Floyd | 17,650 | 51.3% | 5 | $229,447,514 | 16.4% | 5 | 10 |
| Leslie | 5,003 | 50.7% | 5 | $24,335,506 | 12.4% | 5 | 10 |
| Cumberland | 3,034 | 50.6% | 5 | $15,020,468 | 5.9% | 4 | 9 |
| Letcher | 10,252 | 50.2% | 5 | $71,028,964 | 13.2% | 5 | 10 |
| Menifee | 3,148 | 50.1% | 5 | $11,821,120 | 10.3% | 5 | 10 |
| Jackson | 6,559 | 50.1% | 5 | $13,367,452 | 6.5% | 4 | 9 |
| Wayne | 9,766 | 49.9% | 5 | $58,911,848 | 10.5% | 5 | 10 |
| Lee | 3,497 | 48.0% | 5 | $14,950,753 | 9.3% | 5 | 10 |
| Adair | 9,108 | 47.3% | 5 | $53,038,499 | 9.3% | 4 | 9 |
| Powell | 6,021 | 46.4% | 5 | $19,479,185 | 5.8% | 4 | 9 |
| Martin | 5,058 | 46.3% | 5 | $14,890,645 | 7.0% | 4 | 9 |
| Lewis | 5,982 | 46.1% | 4 | $16,200,367 | 6.4% | 4 | 8 |
| Estill | 6,354 | 45.6% | 4 | $23,826,448 | 8.2% | 4 | 8 |
| Rockcastle | 7,314 | 45.2% | 4 | $74,966,379 | 17.4% | 5 | 9 |
| Johnson | 9,945 | 45.0% | 4 | $44,389,998 | 7.2% | 4 | 8 |
| Bath | 5,832 | 44.9% | 4 | $15,855,403 | 6.1% | 4 | 8 |
| Casey | 6,971 | 43.8% | 4 | $55,417,209 | 11.5% | 5 | 9 |
| Metcalfe | 4,587 | 43.8% | 4 | $36,124,241 | 14.2% | 5 | 9 |
| Lawrence | 6,974 | 43.6% | 4 | $67,314,286 | 12.5% | 5 | 9 |
| Pulaski | 28,510 | 43.1% | 4 | $403,539,278 | 13.3% | 5 | 9 |
| Russell | 7,869 | 43.0% | 4 | $61,433,801 | 5.8% | 4 | 8 |
| Laurel | 27,052 | 42.7% | 4 | $168,796,413 | 5.7% | 3 | 7 |
| Pike | 23,853 | 42.6% | 4 | $225,590,814 | 8.5% | 4 | 8 |
| Fulton | 2,689 | 42.4% | 4 | $7,962,566 | 2.8% | 2 | 6 |
| Carter | 11,092 | 42.1% | 4 | $42,728,687 | 6.4% | 4 | 8 |
| Washington | 5,099 | 41.6% | 4 | $24,701,836 | 5.3% | 3 | 7 |
| Butler | 4,983 | 40.3% | 4 | $18,645,942 | 4.6% | 3 | 7 |
| Monroe | 4,536 | 40.1% | 4 | $16,606,766 | 3.7% | 3 | 7 |
| Lincoln | 9,892 | 39.9% | 4 | $31,051,247 | 5.2% | 3 | 7 |
| Mason | 6,677 | 39.6% | 4 | $59,321,564 | 4.7% | 3 | 7 |
| Elliott | 2,870 | 39.6% | 4 | $9,509,192 | 8.6% | 4 | 8 |
| Green | 4,426 | 38.6% | 4 | $75,166,977 | 31.5% | 5 | 9 |
| Grayson | 10,343 | 38.6% | 4 | $49,710,680 | 5.0% | 3 | 7 |
| Rowan | 9,294 | 38.1% | 4 | $105,765,237 | 9.9% | 5 | 9 |
| Fleming | 5,874 | 38.0% | 4 | $18,229,728 | 4.2% | 3 | 7 |
| Nicholas | 2,919 | 38.0% | 3 | $3,982,057 | 3.0% | 2 | 5 |
| Montgomery | 10,604 | 37.2% | 3 | $79,622,219 | 5.8% | 4 | 7 |
| Carroll | 4,067 | 37.0% | 3 | $16,651,231 | 0.7% | 1 | 4 |
| Taylor | 9,740 | 36.8% | 3 | $94,234,554 | 8.1% | 4 | 7 |
| Ohio | 8,691 | 36.8% | 3 | $43,790,481 | 4.1% | 3 | 6 |
| Hickman | 1,634 | 36.7% | 3 | $10,307,565 | 3.7% | 3 | 6 |
| Hart | 7,244 | 36.7% | 3 | $22,127,272 | 2.6% | 2 | 5 |
| Muhlenberg | 11,122 | 36.4% | 3 | $47,025,751 | 3.0% | 2 | 5 |
| Morgan | 5,183 | 36.3% | 3 | $18,709,463 | 5.0% | 3 | 6 |
| Edmonson | 4,448 | 35.7% | 3 | $13,798,873 | 5.5% | 3 | 6 |
| Garrard | 6,346 | 35.6% | 3 | $11,361,117 | 2.6% | 2 | 5 |
| Boyd | 16,860 | 35.3% | 3 | $231,013,716 | 6.1% | 4 | 7 |
| Carlisle | 1,643 | 34.9% | 3 | $5,307,063 | 2.0% | 1 | 4 |
| Barren | 15,615 | 34.7% | 3 | $129,689,090 | 6.9% | 4 | 7 |
| Graves | 12,601 | 34.6% | 3 | $70,533,543 | 4.0% | 3 | 6 |
| Hopkins | 15,449 | 34.4% | 3 | $133,759,751 | 5.0% | 3 | 6 |
| Allen | 7,459 | 34.2% | 3 | $36,423,007 | 5.9% | 4 | 7 |
| Grant | 8,640 | 33.7% | 3 | $30,425,490 | 3.9% | 3 | 6 |
| Owen | 3,798 | 33.6% | 3 | $9,432,534 | 3.6% | 2 | 5 |
| Bourbon | 6,758 | 33.6% | 3 | $40,241,023 | 3.1% | 2 | 5 |
| Breckinridge | 7,047 | 33.4% | 3 | $21,239,952 | 3.9% | 3 | 6 |
| Caldwell | 4,145 | 33.0% | 3 | $18,929,094 | 3.5% | 2 | 5 |
| Jefferson | 254,767 | 33.0% | 3 | $2,767,838,504 | 3.5% | 2 | 5 |
| Clark | 12,255 | 32.9% | 3 | $83,525,261 | 4.1% | 3 | 6 |
| Warren | 46,687 | 32.8% | 2 | $435,344,686 | 3.9% | 3 | 5 |
| Robertson | 754 | 32.6% | 2 | $4,396,714 | 10.5% | 5 | 7 |
| Webster | 4,142 | 32.5% | 2 | $9,662,115 | 1.8% | 1 | 3 |
| McLean | 2,935 | 32.4% | 2 | $8,461,666 | 0.5% | 1 | 3 |
| Larue | 4,922 | 32.2% | 2 | $24,758,598 | 7.9% | 4 | 6 |
| Greenup | 11,276 | 32.0% | 2 | $60,089,121 | 5.6% | 3 | 5 |
| Henderson | 14,045 | 31.8% | 2 | $69,372,337 | 2.5% | 2 | 4 |
| Logan | 8,928 | 31.6% | 2 | $24,504,033 | 1.8% | 1 | 3 |
| Bracken | 2,654 | 31.5% | 2 | $4,503,118 | 2.1% | 1 | 3 |
| Marion | 6,187 | 31.2% | 2 | $46,824,185 | 13.6% | 5 | 7 |
| Harrison | 6,053 | 31.2% | 2 | $37,280,615 | 5.2% | 3 | 5 |
| Daviess | 32,111 | 31.0% | 2 | $349,834,783 | 5.7% | 3 | 5 |
| Union | 4,062 | 31.0% | 2 | $17,205,764 | 1.5% | 1 | 3 |
| Jessamine | 16,925 | 30.8% | 2 | $79,359,993 | 2.6% | 2 | 4 |
| Livingston | 2,728 | 30.7% | 2 | $11,481,794 | 2.2% | 1 | 3 |
| McCracken | 20,513 | 30.4% | 2 | $218,539,943 | 12.4% | 5 | 7 |
| Simpson | 6,118 | 30.3% | 2 | $28,092,200 | 2.3% | 2 | 4 |
| Mercer | 6,985 | 30.2% | 2 | $25,277,506 | 2.2% | 1 | 3 |
| Todd | 3,756 | 30.1% | 2 | $10,418,085 | 1.8% | 1 | 3 |
| Henry | 4,777 | 29.9% | 2 | $14,388,421 | 3.0% | 2 | 4 |
| Ballard | 2,261 | 29.8% | 2 | $6,404,066 | 1.8% | 1 | 3 |
| Pendleton | 4,397 | 29.7% | 2 | $8,493,267 | 2.1% | 1 | 3 |
| Madison | 28,416 | 29.4% | 2 | $218,892,376 | 3.1% | 2 | 4 |
| Boyle | 8,884 | 28.7% | 2 | $106,001,915 | 6.0% | 4 | 6 |
| Franklin | 14,643 | 28.4% | 1 | $98,899,040 | 2.2% | 1 | 2 |
| Gallatin | 2,482 | 28.2% | 1 | $11,823,561 | 2.6% | 2 | 3 |
| Christian | 20,296 | 28.2% | 1 | $161,993,512 | 2.1% | 1 | 2 |
| Trimble | 2,423 | 28.2% | 1 | $5,657,725 | 0.8% | 1 | 2 |
| Trigg | 4,037 | 28.1% | 1 | $12,016,018 | 2.6% | 2 | 3 |
| Hardin | 31,263 | 27.8% | 1 | $338,115,950 | 4.6% | 3 | 4 |
| Crittenden | 2,481 | 27.6% | 1 | $9,305,298 | 3.8% | 3 | 4 |
| Hancock | 2,405 | 27.0% | 1 | $5,788,630 | 0.6% | 1 | 2 |
| Marshall | 8,367 | 26.4% | 1 | $40,796,592 | 0.9% | 1 | 2 |
| Nelson | 12,467 | 26.1% | 1 | $71,810,716 | 3.0% | 2 | 3 |
| Calloway | 9,865 | 25.8% | 1 | $52,676,958 | 2.8% | 2 | 3 |
| Oldham | 18,029 | 25.7% | 1 | $96,743,541 | 3.2% | 2 | 3 |
| Fayette | 81,771 | 25.5% | 1 | $1,581,297,593 | 5.5% | 3 | 4 |
| Anderson | 6,058 | 24.6% | 1 | $18,534,338 | 2.3% | 2 | 3 |
| Meade | 7,350 | 24.4% | 1 | $15,083,930 | 1.5% | 1 | 2 |
| Kenton | 38,972 | 22.7% | 1 | $374,577,736 | 3.0% | 2 | 3 |
| Scott | 13,324 | 22.1% | 1 | $71,785,913 | 1.6% | 1 | 2 |
| Bullitt | 18,766 | 22.1% | 1 | $47,585,938 | 1.2% | 1 | 2 |
| Shelby | 10,285 | 20.8% | 1 | $50,614,692 | 2.1% | 1 | 2 |
| Woodford | 5,548 | 20.3% | 1 | $20,681,387 | 1.3% | 1 | 2 |
| Lyon | 1,806 | 19.7% | 1 | $7,339,579 | 2.2% | 1 | 2 |
| Boone | 27,505 | 19.6% | 1 | $203,121,790 | 1.2% | 1 | 2 |
| Campbell | 17,208 | 18.4% | 1 | $126,236,900 | 2.5% | 2 | 3 |
| Spencer | 3,615 | 17.6% | 1 | $9,971,272 | 2.2% | 2 | 3 |

- The index ranks counties on each of these two indicators, sorts them into quintiles (20% of counties) and gives them a score between 1 and 5 for coverage and for economic activity. It adds them together for a total vulnerability score in each county of between 2 (lowest vulnerability) and 10 (highest).