• Skip to primary navigation
  • Skip to main content
  • Skip to primary sidebar
  • Skip to footer
Kentucky Center for Economic Policy

Kentucky Center for Economic Policy


  • About Us
  • Press Room
  • Donate
  • KyPolicy Conference

Research That Works for Kentucky

  • Topics
    • Budget & Tax
    • Criminal Justice
    • Economic Security
    • Education
    • Health Care
    • Jobs & The Economy
  • Types
    • News
    • Op-Ed
    • Research


  • About Us
  • Press Room
  • Donate
  • KyPolicy Conference

Privacy Policy Terms & Conditions Sitemap

Analysis

How Income Inequality Looks Across Kentucky Counties

Dustin Pugel | June 16, 2016

The average income of the top 1 percent of Kentuckians is 16.6 times greater the average income of everyone else in the state according to a new report by the Economic Policy Institute. The report determined the average income of the top 1 percent earners in Kentucky is $619,585 compared to an average income of $37,371 for the “bottom” 99 percent using IRS tax return data from 2013.

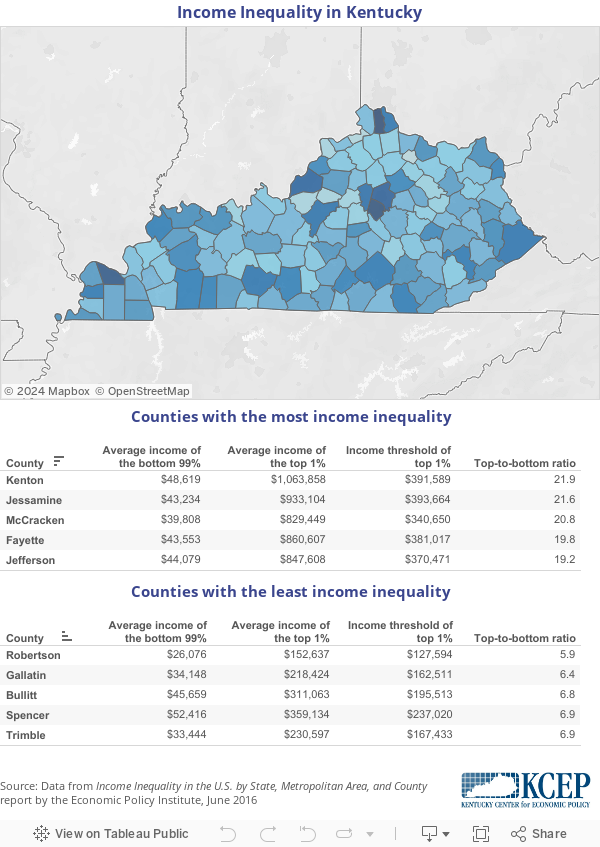
When looking at counties, the ratio of top income earners to the rest varies from 5.9 in Robertson county to 21.9 in Kenton county. Generally speaking, the greatest income inequality is in the so-called “golden triangle” bounded by the Northern Kentucky, Lexington, and Louisville areas that contain neighborhoods of both great wealth and high poverty. However, Pike County in eastern Kentucky and McCracken County in western Kentucky also were among the 10 counties with the highest income inequality.

More On Economic Security: Affordability Is a Crisis for Kentuckians. Here’s What State Leaders Can Do About It.

Oldham County had the highest incomes for both the 1 percent and the 99 percent, and was still among counties with the most income inequality (24th). In contrast, Robertson County had the lowest average income for the top 1 percent of earners and also had the lowest income inequality.

See larger version of map here.

The report also details the income inequality in major metropolitan areas, including 25 contained all or in part in Kentucky. These areas ranged from 1 percent earners making 9.5 times more than the rest in Frankfort to 18.6 times more in Paducah.

Print Friendly, PDF & Email

FacebookTweetLinkedInEmail

Primary Sidebar

Get KyPolicy news updates in your inbox

Sign Up

Sidebar

Perspectives

Affordability Is a Crisis for Kentuckians. Here’s What State Leaders Can Do About It.

The Fight in D. C. Is About Making Life, and Health Care, More Affordable 

Make No Mistake, The Big Beautiful Bill Weakens Medicaid

The BlueOval SK Union Vote Is a Fight for All Kentucky Workers

Job Corps Closings Raises Question of What Cuts Are Really All About

Other Economic Security Items

Building a Kentucky Workers Can Afford

Analysis

Building a Kentucky Workers Can Afford

Affordability Is a Crisis for Kentuckians

Analysis

Affordability Is a Crisis for Kentuckians

snap changes in obbba

Analysis

For Tens of Thousands of Kentuckians Participating in SNAP, the Shutdown Is Just Beginning

Ky. Policy

Footer

Research that works for Kentucky

433 Chestnut Street, Berea, KY 40403

859-756-4605

General information and inquiries: info@kypolicy.org


Help us make the facts free and accessible to everyone. That’s how Kentucky will thrive.

Donate

  • Topics
    • Budget & Tax
    • Criminal Justice
    • Economic Security
    • Education
    • Health Care
    • Jobs & The Economy
  • Work
    • News
    • Op-Ed
    • Research
  • About Us
  • Press Room
  • Contact

Get KyPolicy news updates in your inbox

Sign Up

Privacy Policy Terms & Conditions Sitemap

made by P&P
We use cookies to ensure that we give you the best experience on our website. If you continue to use this site we will assume that you are happy with it.Ok