Click here for a PDF of this report.
Proponents of shifting away from income taxes often point to Tennessee’s heavy reliance on sales taxes as a formula for economic growth in Kentucky. But research does not support the idea that cutting income taxes, a huge tax break for the wealthy, and shifting to a consumption-based system that asks more of those with less will help a state’s economy. Furthermore, a closer look at the consequences of Tennessee’s tax policies – for example, a deeply upside down tax system at odds with the economy, the need for regular sales tax rate increases and one of the worst school funding levels in the country – reinforces that Tennessee does not have tax policy Kentucky needs.
Lower Income Taxes Don’t Deliver Promised Economic Growth
Kentuckians are familiar with the claim we can improve our economic standing relative to other states by reducing certain taxes, especially income taxes. In 2008, economists at the Center on Business and Economic Research (CBER) at the University of Kentucky explored this suggestion by examining the impact of various factors on Kentucky’s and our neighbor states’ economic growth. They found individual and corporate income taxes as a share of the economy do not have a statistically significant impact on states’ economic growth.1 Rather, the variables they found most significantly related to growth have to do with a state’s “stock of knowledge” – educational attainment, the average number of patents per resident and research and development spending.2 Those factors depend in significant part on the investments made with state tax revenue.
CBER’s findings are in line with a growing body of research showing that reducing state income taxes is unlikely to speed economic growth.3 The reasons why include:
- States must balance their budgets, so income tax cuts often lead to cuts to essential public investments in education, infrastructure and other important investments at the core of successful economies.
- People infrequently move across states and rarely make decisions about where to live based on state income taxes.4
- Income tax cuts are not targeted to business owners, meaning they are not even a cost-effective subsidy for businesses.5
Despite the evidence, many states have experimented with cutting income taxes in recent years under the misguided promise that doing so would be an effective way to improve job and economic growth. Kansas’s disastrous (and recently partially reversed) attempt to “march” income taxes “to zero” is a chief example.6 Instead of states’ economies leaping ahead, income tax reductions often have been followed by ballooning structural deficits and harmful budget cuts to education and other essential investments. For instance, 7 out of the 12 states that have cut their core K-12 education funding the most since the recession (2008-2018) have also cut income taxes since 2008.7 North Carolina, among that group of 7, started phasing in corporate and individual income tax cuts in 2013 estimated to cost $3.5 billion annually on full implementation in 2019.8 And despite being championed as an exemplar of income tax cutting, North Carolina has economically underperformed two out of four neighbor states in total private employment growth and three out of four neighbor states in real GDP growth since the tax cuts were implemented.9
Tennessee’s Economy is Leaving Families Behind
Simple comparisons between Kentucky and Tennessee that make broad claims based on any single policy or factor are misleading and erroneous. There are many differences between the two states shaped by their unique histories – the size of their tourism industries, the number of large cities and the presence of institutions like Tennessee’s Oak Ridge National Laboratory, Vanderbilt University and Tennessee Valley Authority to name a few – that necessarily complicate comparisons.
That being said, it is not clear Tennessee is heading in a stronger direction than Kentucky. Both rank low on many indicators of overall well-being including families’ economic security. While Tennessee’s current median household income is slightly better than Kentucky’s – $48,547 compared to $46,659 in 2016 – the trajectory since 2000 favors Kentucky with median income having grown (1.9 percent) but having fallen in Tennessee (-4.7 percent).
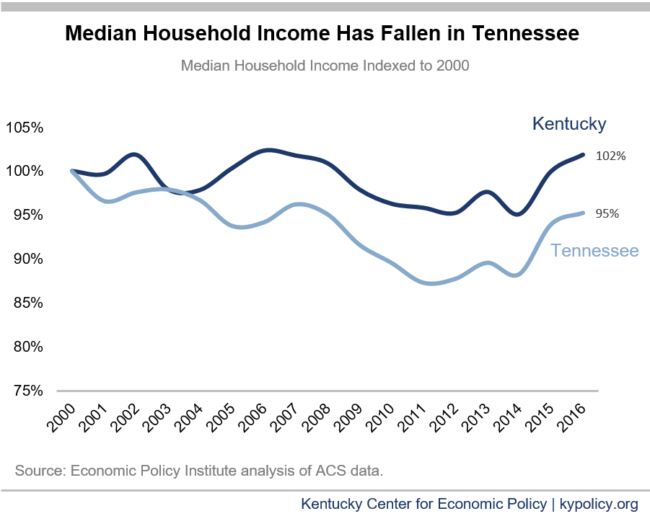
Eroding household income cannot be singly attributed to Tennessee’s upside-down tax system. But relying so heavily on sales taxes – which ask more of those with less – squeezes low-to-middle income households’ already tight resources.
Comparing economic indicators in Tennessee and the eight other states without a personal income tax to the nine states with the highest top marginal income tax rates provides further evidence that families in the former group are not better off. Per capita growth rates over the last decade for GDP, personal income, disposable personal income and personal consumption were all higher in the nine states with the highest personal income taxes.10
Tennessee’s Extremely “Upside-Down” Tax System Is Disconnected from Economy
Compared to wealthy households, low- to moderate-income families pay more in sales taxes because they have to spend a larger share of their income to meet their basic needs (rather than saving or investing), meaning a larger portion is subject to taxation. On the other hand, an income tax with graduated rates that rise as one’s income increases is based on taxpayers’ ability to pay. Shifting from income taxes to sales taxes would make Kentucky’s tax system more steeply “regressive” – that is, carried more heavily by middle- and low-income families – like Tennessee’s.11 For example, replacing 100 percent of Kentucky’s income tax revenue with revenue from an expanded sales tax would be a tax cut of $32,000 a year for the wealthiest 1 percent of Kentuckians, and a tax hike on the bottom 60 percent of Kentuckians.12
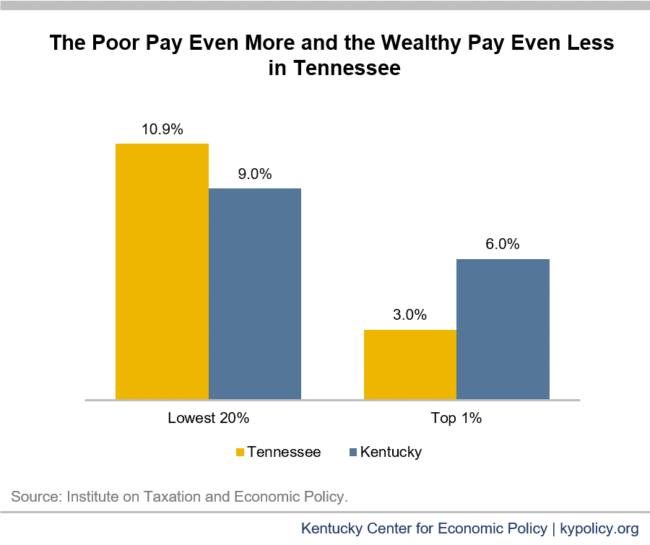
As a result of its heavy reliance on sales taxes and lack of a broad-based income tax, Tennessee has the seventh most regressive revenue system in the country.13 As the graph below shows, the wealthiest 1 percent of households in Tennessee pay only 3 percent of income in state and local taxes, while the poorest 20 percent pay 10.9 percent. Kentucky’s tax system is also regressive, but less so, ranking 33rd most regressive overall: the wealthiest 1 percent of families pay 6 percent of their income in state and local taxes, while families at the bottom pay 9 percent.
An upside-down tax system also undermines revenue growth in an economy where such a large share of all economic growth is being captured by the very wealthy. According to analysis by the Economic Policy Institute, in Kentucky between 1979 and 2013, real income for the top 1 percent grew 60 percent but fell for everyone else by 3 percent.14 Cutting income taxes to become more like Tennessee would be a huge tax break for the wealthy that would make our revenue system even less able to keep up with economic growth than it already is.15 In other words, a consumption-based tax system would make it harder to reliably invest in education and other core building blocks of widespread prosperity. Research from Standard and Poor’s credit rating agency finds that sales tax reliant states have an especially hard time maintaining revenue for investments at a time of growing income inequality.16
Poor Sales Tax Growth Results in Less Revenue for Investments, Need for Tax Hikes
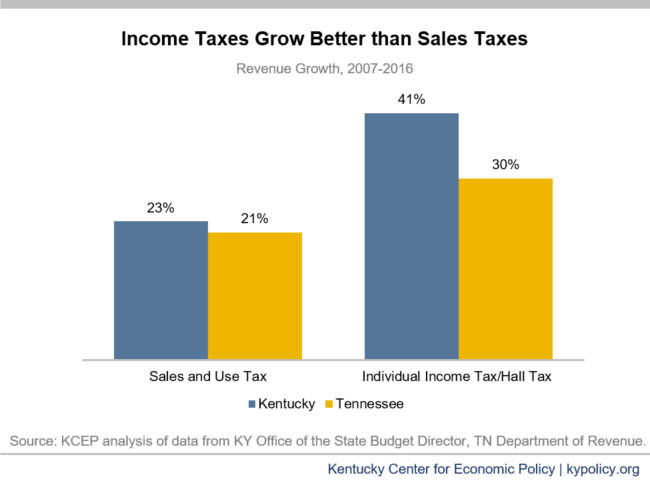
The graph below compares annual sales tax revenue growth rates in both Tennessee and Kentucky to annual income tax growth in each state (Tennessee’s very limited Hall Tax on investment income comprises two percent of state revenue and is being phased out). In Tennessee, even with a broader sales tax base that includes groceries and more services (67) than Kentucky’s (28, no groceries), sales tax growth lags behind income tax growth.17
This slower growth translates to fewer dollars for investments over time. If Kentucky’s individual income tax had grown between 2007 and 2016 at the overall rate of the sales tax (23 percent) instead of its own more robust rate (41 percent) – a proxy for what might have happened if we shifted completely from income to sales taxes in 2007 – we would have had $544 million less in revenue in 2016. That’s about the total budgeted amount that year for child care, preschool, family services (child protection, home safety, preventive services), school-based Family Resource and Youth Service Centers (FRYSCs), career and technical education and Community Mental Health Centers combined.18
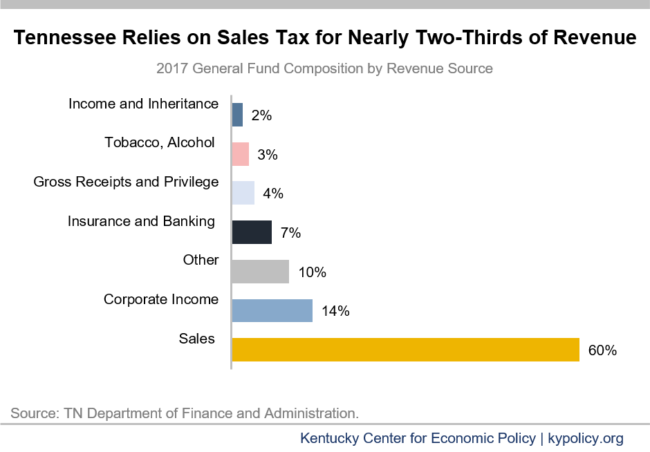
With a full 60 percent of Tennessee’s General Fund revenue coming from the sales tax (see pie chart below), its slower growth fundamentally shapes decisions the state makes about taxation and investments. As Tennessee’s comptroller explained last year, “Since the 1960’s Tennessee’s primary source of revenue has been the sales tax. As the cost of government operations increases, the General Assembly has raised the sales tax rate every 6 to 8 years to continue providing the same services.”19 As noted previously, these sales tax hikes hit low-income families the hardest and ask the least of those with the most wealth.
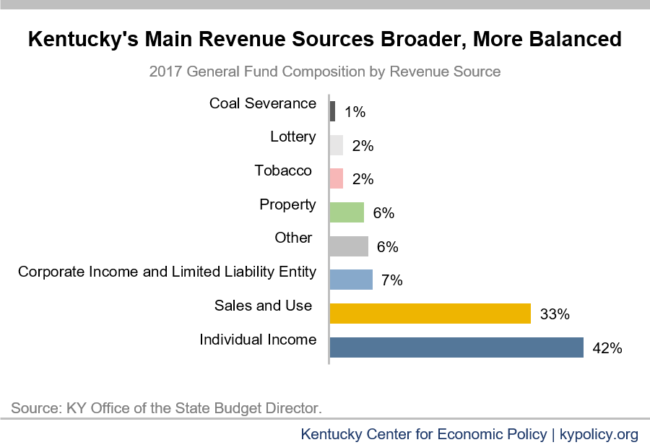
Kentucky’s revenue system – though certainly in need of reforms that help revenue better track the economy – has a more balanced and reliable mix of revenue sources.20 Our main source of General Fund revenue is the individual income tax, comprising 42 percent of the General Fund in 2017, with sales and use taxes comprising 33 percent.
Lacking a broad-based income tax also means Tennessee relies more heavily on other revenue sources: the share of Tennessee’s General Fund coming from corporate income taxes (14 percent) is twice Kentucky’s (7 percent). In fact, Tennessee’s business taxes are higher than Kentucky’s: it ranks 11th in the nation for its per capita corporate income taxation (Kentucky is 18th), and its 6.5 percent top corporate income tax rate is higher than Kentucky’s 6 percent rate.21
Tennessee is Underinvesting in Its Kids
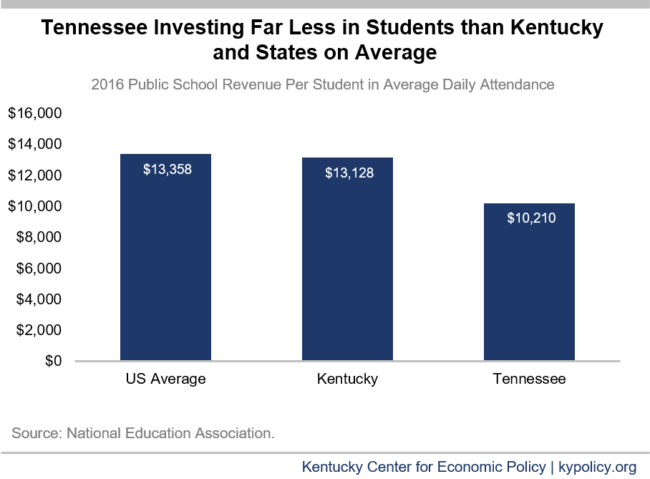
Both Tennessee and Kentucky spend around half of their state revenue on education – 53 percent and 48 percent, respectively – making it the top priority public investment in both states.22 However, the amount we spend per student vastly differs: in 2016, Tennessee ranked 42 out of 51 states and the District of Columbia for the level of public school revenue per student ($10,210) based on average daily attendance. Kentucky, in contrast, ranked 26th at $13,128 per student.23
The University of Kentucky’s Center for Business and Economic Research finds that, once obstacles to desirable education outcomes like poverty, poor health and limited English proficiency are accounted for, Kentucky is 1 of just 11 states where the return on investment for education spending is higher than would be expected.24 In other words, Kentucky invests in its students efficiently and effectively.
Tennessee’s education funding challenges have come close to a breaking point in recent years. A number of school districts have filed lawsuits against the state for unconstitutionally inadequate funding.25 And in 2013, in order to cut costs, the state moved teachers onto a hybrid pension plan instead of the previous defined benefit program – a move that will lower teachers’ overall compensation and make it more difficult to attract and retain the best teachers.
Transitioning to a Tennessee-like tax system would put Kentucky’s education gains at greater risk than they already are – including by causing school districts to compensate for slower state revenue growth with a heavier reliance on local revenue. In Kentucky, local public school revenue in 2016 comprised 32 percent of total state and local revenue, while in Tennessee, it was 44 percent.26 Due to the disparities based on property wealth in what Kentucky’s school districts can generate from local taxes, shifting more public school funding to the local level would worsen the already growing gap between poor and wealthy districts.27 A lack of equity in funding is what led to the Kentucky Educational Reform Act in 1990 which raised significant new revenue, primarily from strengthening the income tax.28
Conclusion
Cleaning up tax breaks, not adding more for people with the most money and influence, will put Kentucky on the path to stronger investments in education, infrastructure and other building blocks of thriving communities. Shifting to a Tennessee-like sales tax based system would add more tax breaks for the wealthiest people, undermine the investments in our communities and our future that benefit us all, and necessitate ongoing tax hikes which are likely to fall heaviest on low income-families.
- Christopher Jepsen, Kenneth Sanford and Kenneth Troske, “Economic Growth in Kentucky: Why Does Kentucky Lag Behind the Rest of the South?” University of Kentucky Center for Business and Economic Research, January 2008. ↩
- The share of the population living in an urban area, as well as the share that have in-migrated to the state, were also found to have an impact. ↩
- Michael Leachman and Michael Mazerov, “State Personal Income Tax Cuts: Still a Poor Strategy for Economic Growth,” Center on Budget and Policy Priorities, May 14, 2015, http://www.cbpp.org/research/state-budget-and-tax/state-personal-income-tax-cuts-still-a-poor-strategy-for-economic. ↩
- Job and family considerations – not taxes – consistently lead people to migrate from one state to another, among the small share of people who move at all. Michael Mazerov, “State Taxes Have a Negligible Impact on Americans’ Interstate Moves,” Center on Budget and Policy Priorities, May 21, 2014, http://www.cbpp.org/research/state-budget-and-tax/state-taxes-have-a-negligible-impact-on-americans-interstate-moves. ↩
- Anna Baumann, “Research Shows Disconnect Between States’ Job Creation Policies and Real World Job Growth,” Kentucky Center for Economic Policy, February 3, 2016, https://kypolicy.org/research-shows-disconnect-between-states-job-creation-policies-and-real-world-job-growth/. ↩
- In fact, a working paper from Oklahoma State University suggests Kansas’s tax cuts didn’t only fail to deliver economic growth, but may have harmed it. Max Ehrenfreund, “Kansas’s conservative experiment may have gone worse than people thought,” Washington Post, June 15, 2017, https://www.washingtonpost.com/news/wonk/wp/2017/06/15/kansas-conservative-experiment-may-have-gone-worse-than-people-thought/?utm_term=.696d7bb0d84e. ↩
- Michael Leachman, Kathleen Masterson and Eric Figueroa, “A Punishing Decade for School Funding,” Center on Budget and Policy Priorities, Nov. 29, 2017, https://www.cbpp.org/research/state-budget-and-tax/a-punishing-decade-for-school-funding. ↩
- Rob Christensen, “The Good, the bad and the ugly of the budget,” The News & Observer, June 24, 2017, http://www.newsobserver.com/news/politics-government/politics-columns-blogs/rob-christensen/article158020594.html. ↩
- Michael Leachman, “North Carolina’s Tax Cuts Haven’t Caused Economy to Surge,” Center on Budget and Policy Priorities, Feb. 27, 2018. https://www.cbpp.org/blog/north-carolinas-tax-cuts-havent-caused-economy-to-surge. ↩
- Carl Davis and Nick Buffie, “Trickle-Down Dries Up: States without Personal Income Taxes Lag Behind States With the Highest Top Tax Rates,” Institute on Taxation and Economic Policy, https://itep.org//www/wp-content/uploads/trickledowndriesup_1017.pdf. ↩
- According to analysis from the Institute for Taxation and Economic Policy (ITEP), adding groceries to Kentucky’s sales tax base (they are taxed in Tennessee at 4 percent) would increase the share of income that families in the bottom income quintile pay by ten times more than it would increase what the wealthiest one percent pay. Anna Baumann, “Taxing Groceries in Kentucky Would Hurt Low-Income Families, Weaken Revenue Growth,” Kentucky Center for Economic Policy, April 12, 2017, https://kypolicy.org/taxing-groceries-kentucky-hurt-low-income-families-weaken-revenue-growth/. ↩
- Institute for Taxation and Economic Policy. ↩
- Institute on Taxation and Economic Policy, “Who Pays? A 50 State Report,” January 2015, https://itep.org/whopays/. ↩
- Estelle Sommeiller, Mark Price and Ellis Wazeter, “Income Inequality in the U.S. by State, Metropolitan Area and County,” Economic Policy Institute, June 2016, http://www.epi.org/files/pdf/107100.pdf. ↩
- Anna Baumann, “Continuing General Fund Erosion is More Evidence of the Need to Clean Up Tax Code,” Kentucky Center for Economic Policy, August 2, 2017, https://kypolicy.org/continuing-general-fund-erosion-evidence-need-clean-tax-code/. ↩
- Gabriel Petek, “Income Inequality Weighs On State Tax Revenues,” Standard and Poor’s Global Market Intelligence, September 15, 2014, https://www.globalcreditportal.com/ratingsdirect/renderArticle.do?articleId=1359059&SctArtId=263028&from=CM&nsl_code=LIME&sourceObjectId=8819204&sourceRevId=2&fee_ind=N&exp_date=20240914-19:27:33. ↩
- Federation of Tax Administrators, “Sales Taxation of Services; Summary Table – Number of Services Taxed by State and Category,” 2007, http://www.taxadmin.org/sales-taxation-of-services. ↩
- These are total revised appropriations, including General, Tobacco, Federal and Restricted Funds. Office of the State Budget Director, “2016-2018 Budget of the Commonwealth,” http://osbd.ky.gov/Publications/Documents/Budget%20Documents/2016-2018%20Budget%20of%20the%20Commonwealth/1618BOCVolumeI%20-%206-30-16.pdf. ↩
- Justin Wilson, “Quarterly Fiscal Affairs Report,” Tennessee Office of the Comptroller of the Treasury, January 2016, http://www.comptroller.tn.gov/repository/ms/2016Q1FiscalAffairsReport.pdf. ↩
- Anna Baumann, “Revenue Options that Strengthen the Commonwealth,” Kentucky Center for Economic Policy, February 2, 2016, https://kypolicy.org/new-report-kentucky-can-take-balanced-approach-to-budget-with-revenue-options/. ↩
- Tax Foundation, “Facts and Figures: How Does Your State Compare?” 2017, https://files.taxfoundation.org/20170710170127/TF-Facts-Figures-2017-7-10-2017.pdf. ↩
- TN Department of Finance and Administration, “The Budget, Fiscal Year 2016-2017,” https://www.tn.gov/finance/article/fa-budget-publication-2016-2017. KY Office of the State Budget Director, “2016-2018 Budget of the Commonwealth Budget in Brief,” http://osbd.ky.gov/Publications/Documents/Budget%20Documents/2016-2018%20Budget%20of%20the%20Commonwealth/Budget%20in%20Brief%20-%207-7-16.pdf. ↩
- National Education Association, “Rankings of the States 2016 and Estimates of School Statistics 2017,” NEA Research May 2017, http://www.nea.org/assets/docs/2017_Rankings_and_Estimates_Report-FINAL-SECURED.pdf. ↩
- Michael Childress, “Educational Spending ROI” in 2017 Kentucky Annual Economic Report, University of Kentucky Center for Business and Economic Research, January 2017, http://uknowledge.uky.edu/cgi/viewcontent.cgi?article=1021&context=cber_kentuckyannualreports. ↩
- Education Law Center, “Tennessee,” http://www.edlawcenter.org/states/tennessee.html. ↩
- National Education Association, “Rankings and Estimates.” ↩
- Marcia Ford Seiler, Pam Young, Sabrina Olds et al, “2011 School Finance Report,” Office of Education Accountability, June 12, 2012, http://www.lrc.ky.gov/lrcpubs/RR389.pdf. ↩
- Frankfort Bureau, “Major Reform Provisions,” Lexington Herald-Leader, March 30, 1990. ↩
